
Predicting the economic trajectory of the 21st century
compound growth vs demographics: the war of the century

Here I lay out the base case for what will happen to the global economy if no black swan arrives, be it the singularity, ecological collapse, peak oil, birth rate rises, or death by grey goo. I have my own opinions on these ideas1, but the intent is to lay out the base case of what happens if the status quo continues as is.
To predict our economic trajectory, I used projections of national IQs and age demographics of countries to predict their GDPs from 2023 to 2100 using autoregression.
At the moment, there is not enough information to paint a precise picture, but most projections agree that global economic stagnation will set in sometime between 2040 and 2080, and it will get more difficult for nations to retire their citizens. The bulk of variation in predictions is due to misestimated parameters, not variation in projections of population, global IQ, or the use of any specific statistical model.

I estimated the percentage of countries that would have fiscal troubles with pensions by taking 50% of GDP per capita in 2025 to be an estimate of a pensioner’s state-sponsored income throughout the century. I then identified countries that would be projected to spend over 20% of their GDP on their pensions (context: Italy and Greece spend the most on pensions in the world at 18% of GDP), which I deem an excessive amount. Several countries, notably Spain, Greece, Chile, Korea, and Italy are going to have major issues with their finances going forward.
In the case of pensions, variation in population projections have massive influences on the percentage of countries that end up fiscally insolvent:
I consider this to be an underestimate of how much fiscal budgets will be an issue, as pensions run on a hedonic treadmill and aren’t fixed to a specific income. It’s inevitable that some nations will not choose between raising taxes and reducing pensions, resulting in a mounting deficit that will end in a bailout or hyperinflation.
Regionally speaking, East Asia looks awful, Europe looks good or bad depending on the country, and the United States looks fine. I should note that the European countries projected to have the least troubles with pensions are the ones most likely to have lenient immigration policies.
Israel looks like the best nation in terms of wealth and fiscal budget by far. Russia, Indonesia, Mongolia, Iraq, Libya, and Central Asian countries all look good according to the models, though for some of these countries improvements are contingent on them changing their political system. China should look good midcentury, but will fall off if it doesn’t fix its demographics.
Methodology
I use four main sources of data: the UN’s population projections, national IQ data, IQ/education/fertility data, and the Maddison GDP dataset2. I then create a set of synthetic variables that have their uncertainty estimated using various plausible models and simulated scenarios. First come the national IQs, then GDP per capita, then GDP + estimates of retirement burden.
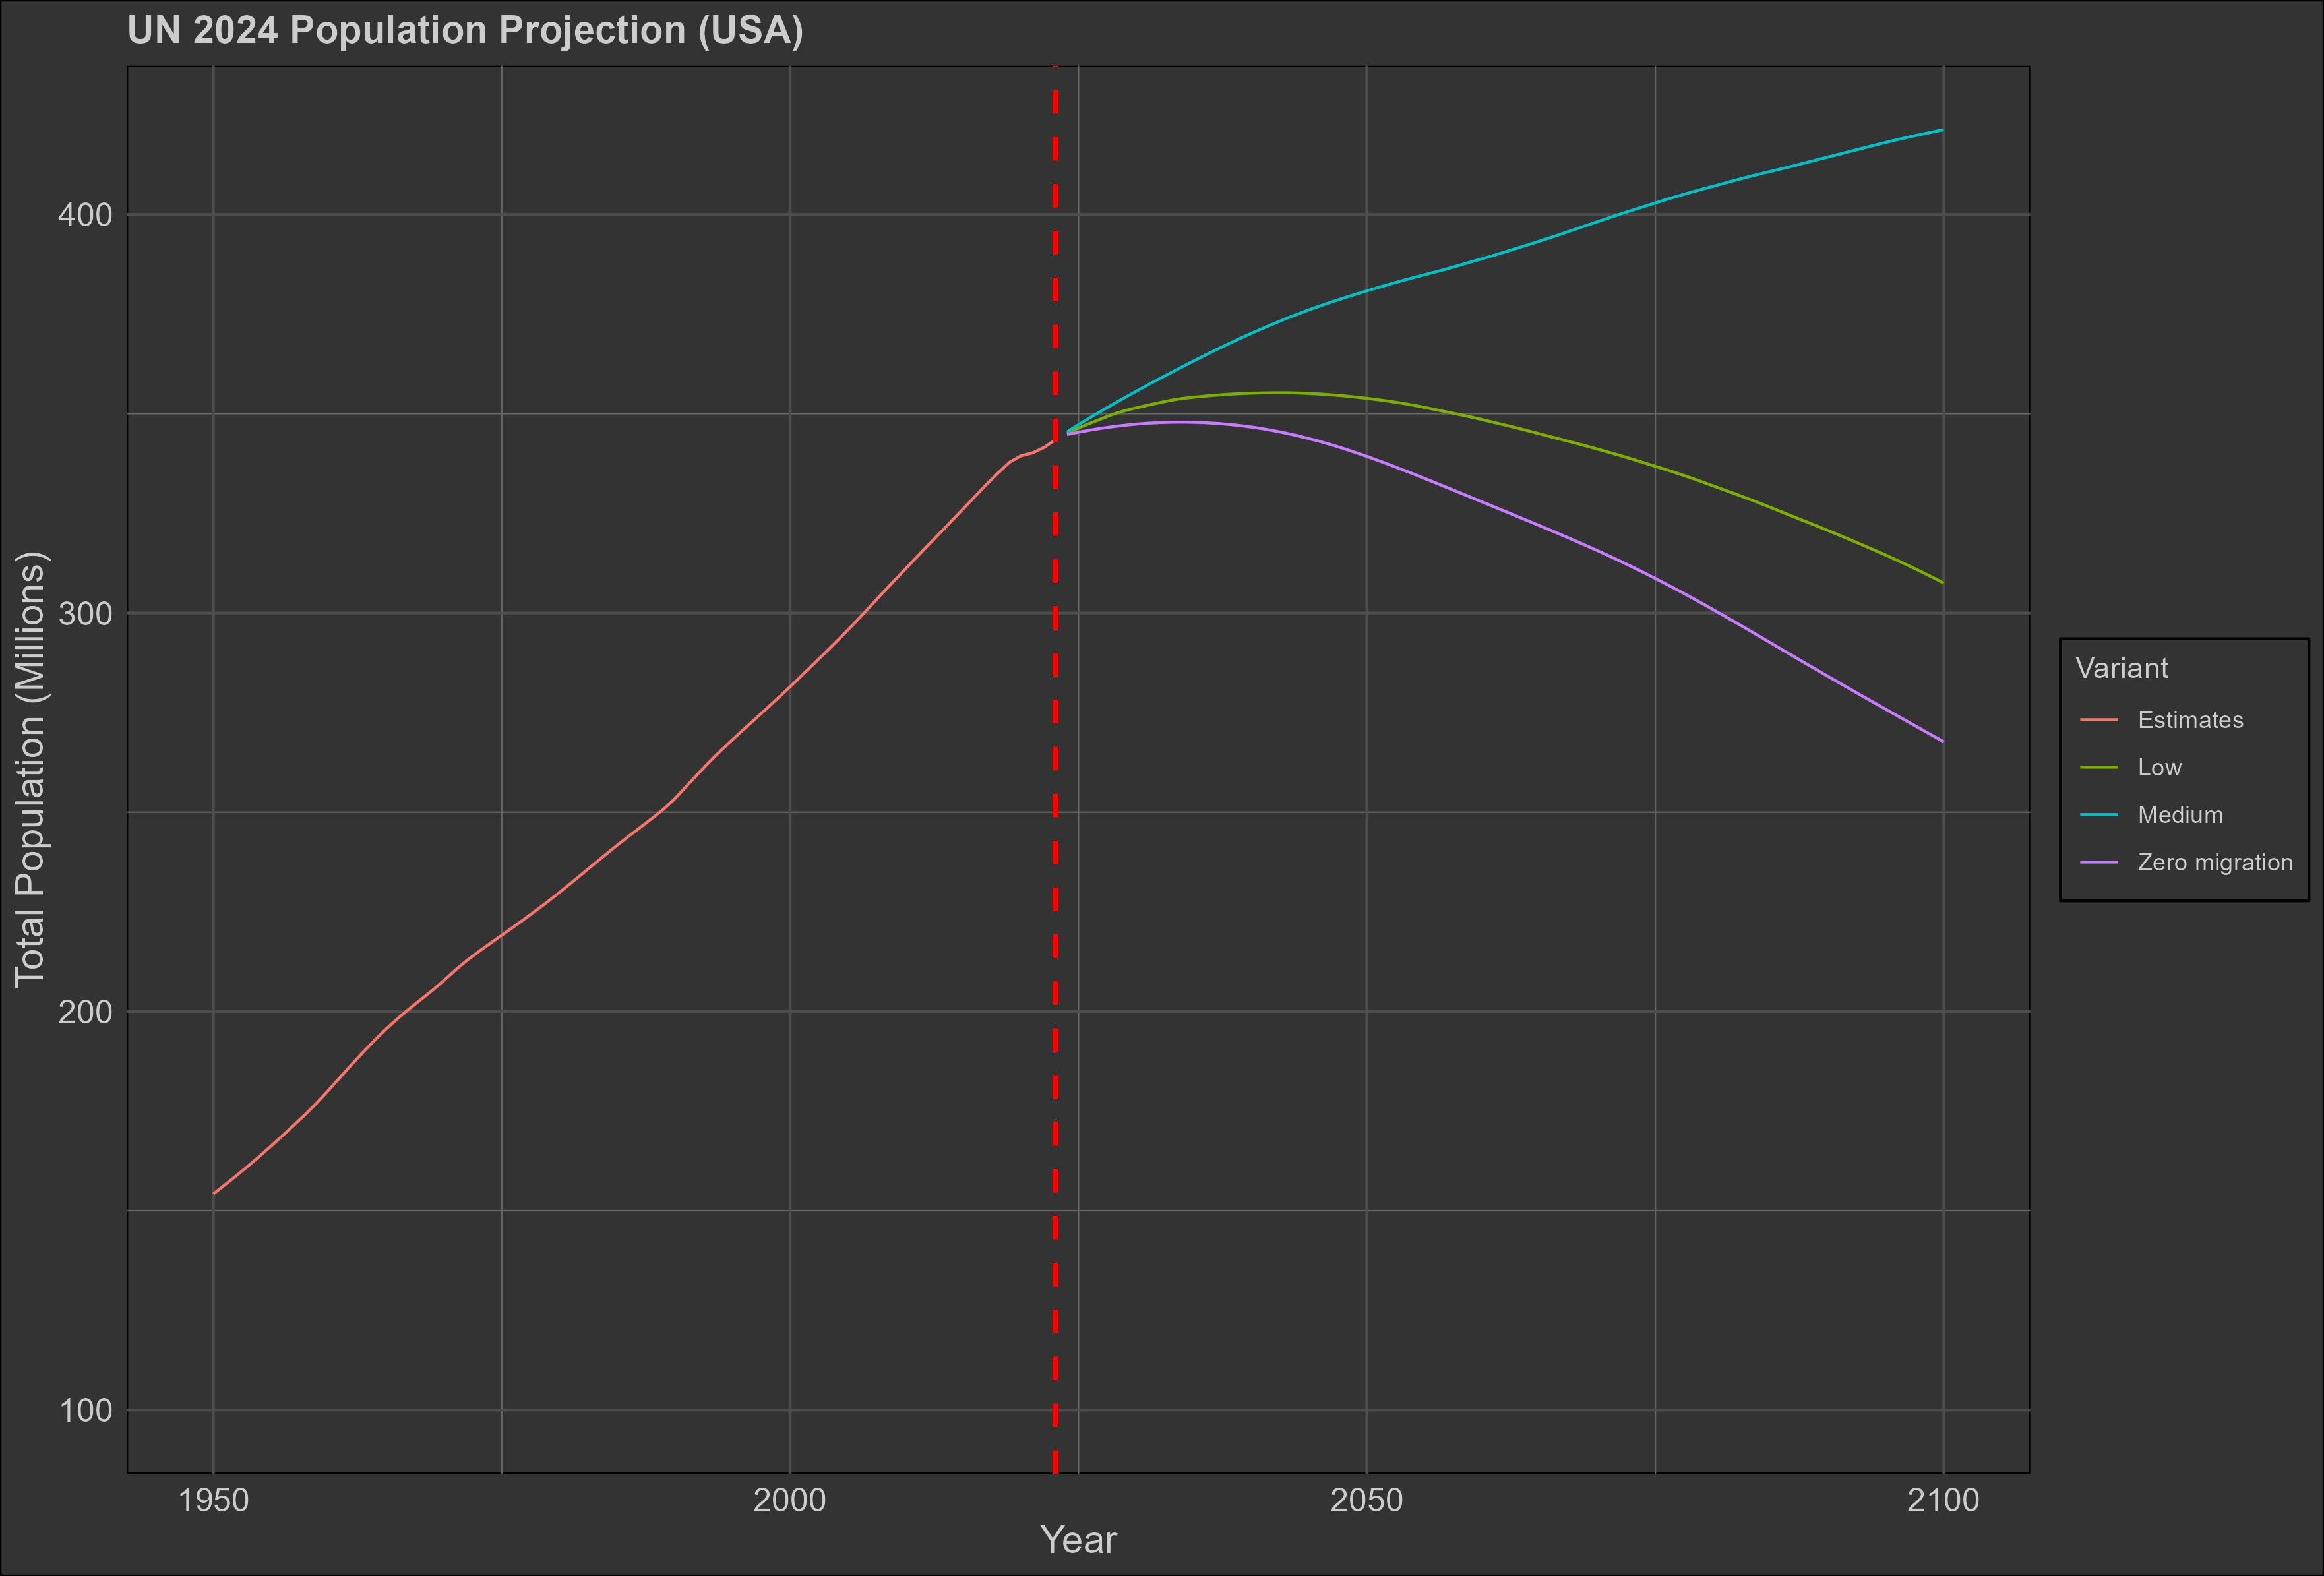
In this study, I use three different population projections: the ‘low’ variant, the ‘medium’ variant, and the ‘zero migration’ variant. All of these labels are self-descriptive, in the sense that the low variant predicts a relatively low population and the zero migration models the world as having no immigration.
To illustrate the differences:
The UN is often criticised for not forecasting properly, particularly for being optimistic and inaccurate. For example, they’ve been predicting South Korean fertility will revert back to sustainable levels for 20 years in a row, despite constant decline:

My friend uncorrelated tried his hand at forecasting fertility trends using machine learning models and was able to beat the UN’s accuracy, but eventually came to the conclusion that the mean-reversion that is observed in fertility forecasts is statistically rational and reflects reversion to the mean. His models, for example, still predicted that South Korea would increase its fertility:

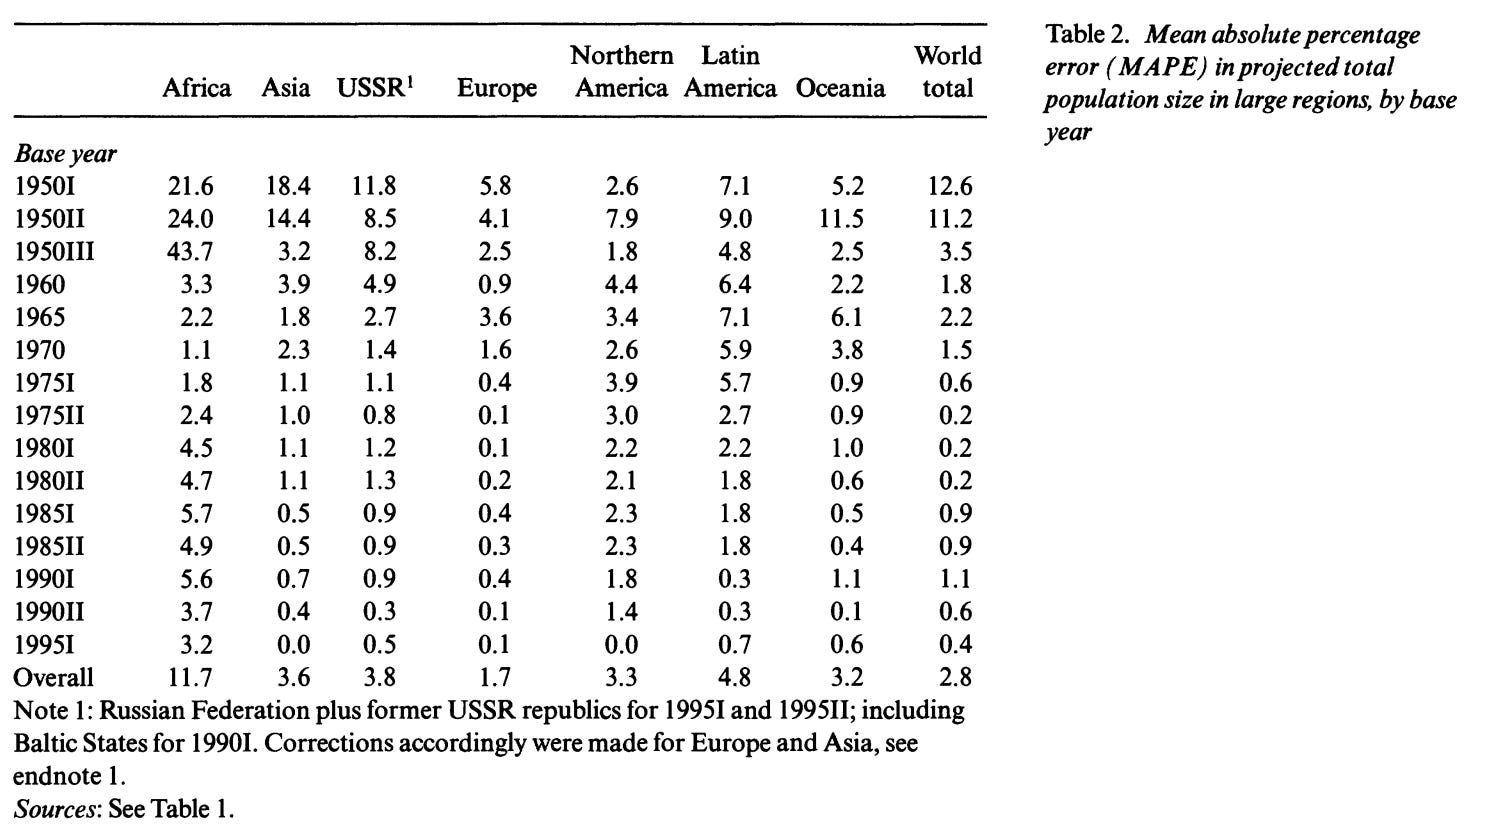
There’s also a lot of historical evidence that suggests the UN has done a good job of forecasting the global population, this is also true at the level of regions, with the UN historically being off by only about 1-5%:
In a similar vein, people often criticise the idea of GDP on the grounds that it is a meaningless metric that can’t be compared across time because of hedonic adjustments and other biases. Here I defer to the defenses made by TotalHealthOptimization and Deep Left Analysis — GDP is not perfect, but it tracks differences in living standards between time and countries very well.
When the economy recedes, GDP drops. When countries adopt market reforms, they get wealthier and their GDP goes up. Poor countries like India, Mexico, and Morocco have lower GDPs than Spain, Japan, and America.
Regarding national IQs — I think they are good enough. If we accept that it’s possible for the average IQ of a country to change, I don’t see what’s wrong with thinking that IQ could vary across countries. They track performance in proxies for intelligence like academic performance across countries extraordinarily well, to the point that PISA/PIRLS/etc tests are now used to measure national IQs. They track differences in economic activity and religious beliefs. I do suspect they have some statistical bias and overestimate difference between nations, though research on this question is unfortunately lacking.
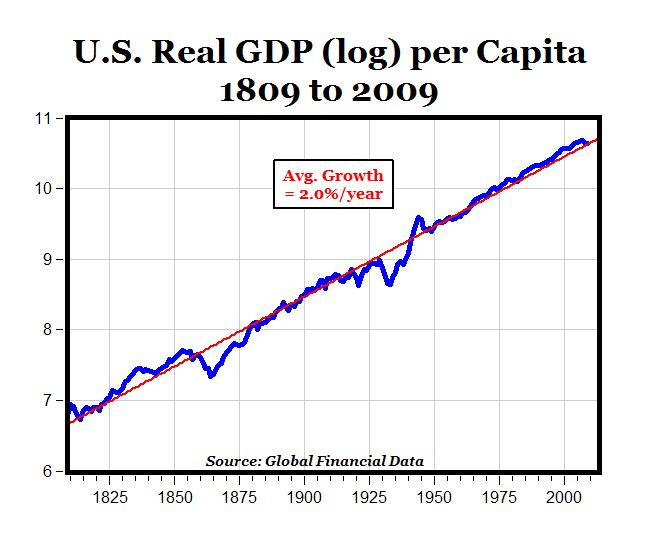
Others may object to the projections that are made on the grounds that some technological advancements like radical life extension or robotics will make these projections moot. Taking the outside view, GDP per capita has grown at a constant rate of about 2% in most industrial economies. No technology, be it cars, vaccines, or the internet has changed this constant rate of growth. That is not to say technology does not have an effect on economic growth, simply that the ones that have come in the past 200 years have not changed the rate at which the economy grows.
With regard to radical life extension, I am skeptical because we don’t even know what causes aging and how it works. There is the goal-direction theory of aging that posits aging reflects a loss of goal direction, there are multicausal damage theories like de Grey’s, immunity theories, programmed-death theories (genes that are good when you are young but bad when you are old are selected for by evolution). I guess you could argue that it only takes one person to be right about aging to make a difference, but I’ll believe it when I see it.
The outside view is also unkind to the idea of radical life extension: the rate at which life expectancy has been improving in developed countries has been slowing down. This is because the death rate exponentially rises with age, so reductions in the death rate lead to increasingly smaller increases in life expectancy.

I didn’t use the high variant because the UN’s population projections are slightly too optimistic as is, both in terms of predicted TFRs and life expectancy. Zero-migration is an untenable assumption, but one could defend the model on the grounds that it does not assume that immigrants will resemble the natives of the countries they migrate to — a more important assumption. As such, I call it the “essentialist” model.
I have my own thoughts on immigration, but I think the idea that it causes global economic growth by taking workers from unproductive countries to productive ones is naive. It’s also an empirical fact that non-western immigrants fiscally constrain the economies they move to and will not make the pension situation any better, so immigration as a functional solution to population decline is dead in the water.

Projecting national IQs forward and backward
I added intelligence as a predictive variable for two reasons: it’s a strong predictor of economic growth between countries, with one IQ point corresponding to an increase in GDP per capita of about 8-10% based on a paper of mine3.
The first thing I did is forecast the world IQ based on the correlations between IQ and fertility by country, average IQ by country, and the world’s population projections. I do not have data for every single country, so occassionally I had to make imputations based on the correlation between education and fertility or values from surrounding countries; a few countries had their NIQs geographically imputed as well. This will bias the results for individual countries, but the direction of the global projection is unchanged.
I built on work I did in a previous paper, with some changes:
I added some new data from the latest PIAAC wave, bringing the total to n = 500,000 and k=183.
I used a different national IQ dataset: V2 of most accurate national IQs possible.
I accounted for uncertainty by calculating forecasts that used different assumptions.
In the original paper, I found that the correlation between IQ and fertility varied by source of data, so I added an uncertainty parameter that accounts for the amount of variance observed between sources.
The correlation between the mid-parent IQ and their child’s IQ could vary between 0.6 and 0.7 based on my own research4.
Varying forecasts by UN population projection.
Generational timings can halt or hasten the effects of differential fertility by IQ, so I tried out three different forecasting methods: using the UN’s forecasts of average age of mothers from 2023-2100, assuming they will not change at all, and assuming that all countries will converge to the average over time (28).
Those efforts led to the conclusion that the world IQ should be expected to fall from 85 to 75-79 by the end of the century, depending on which assumptions are made:
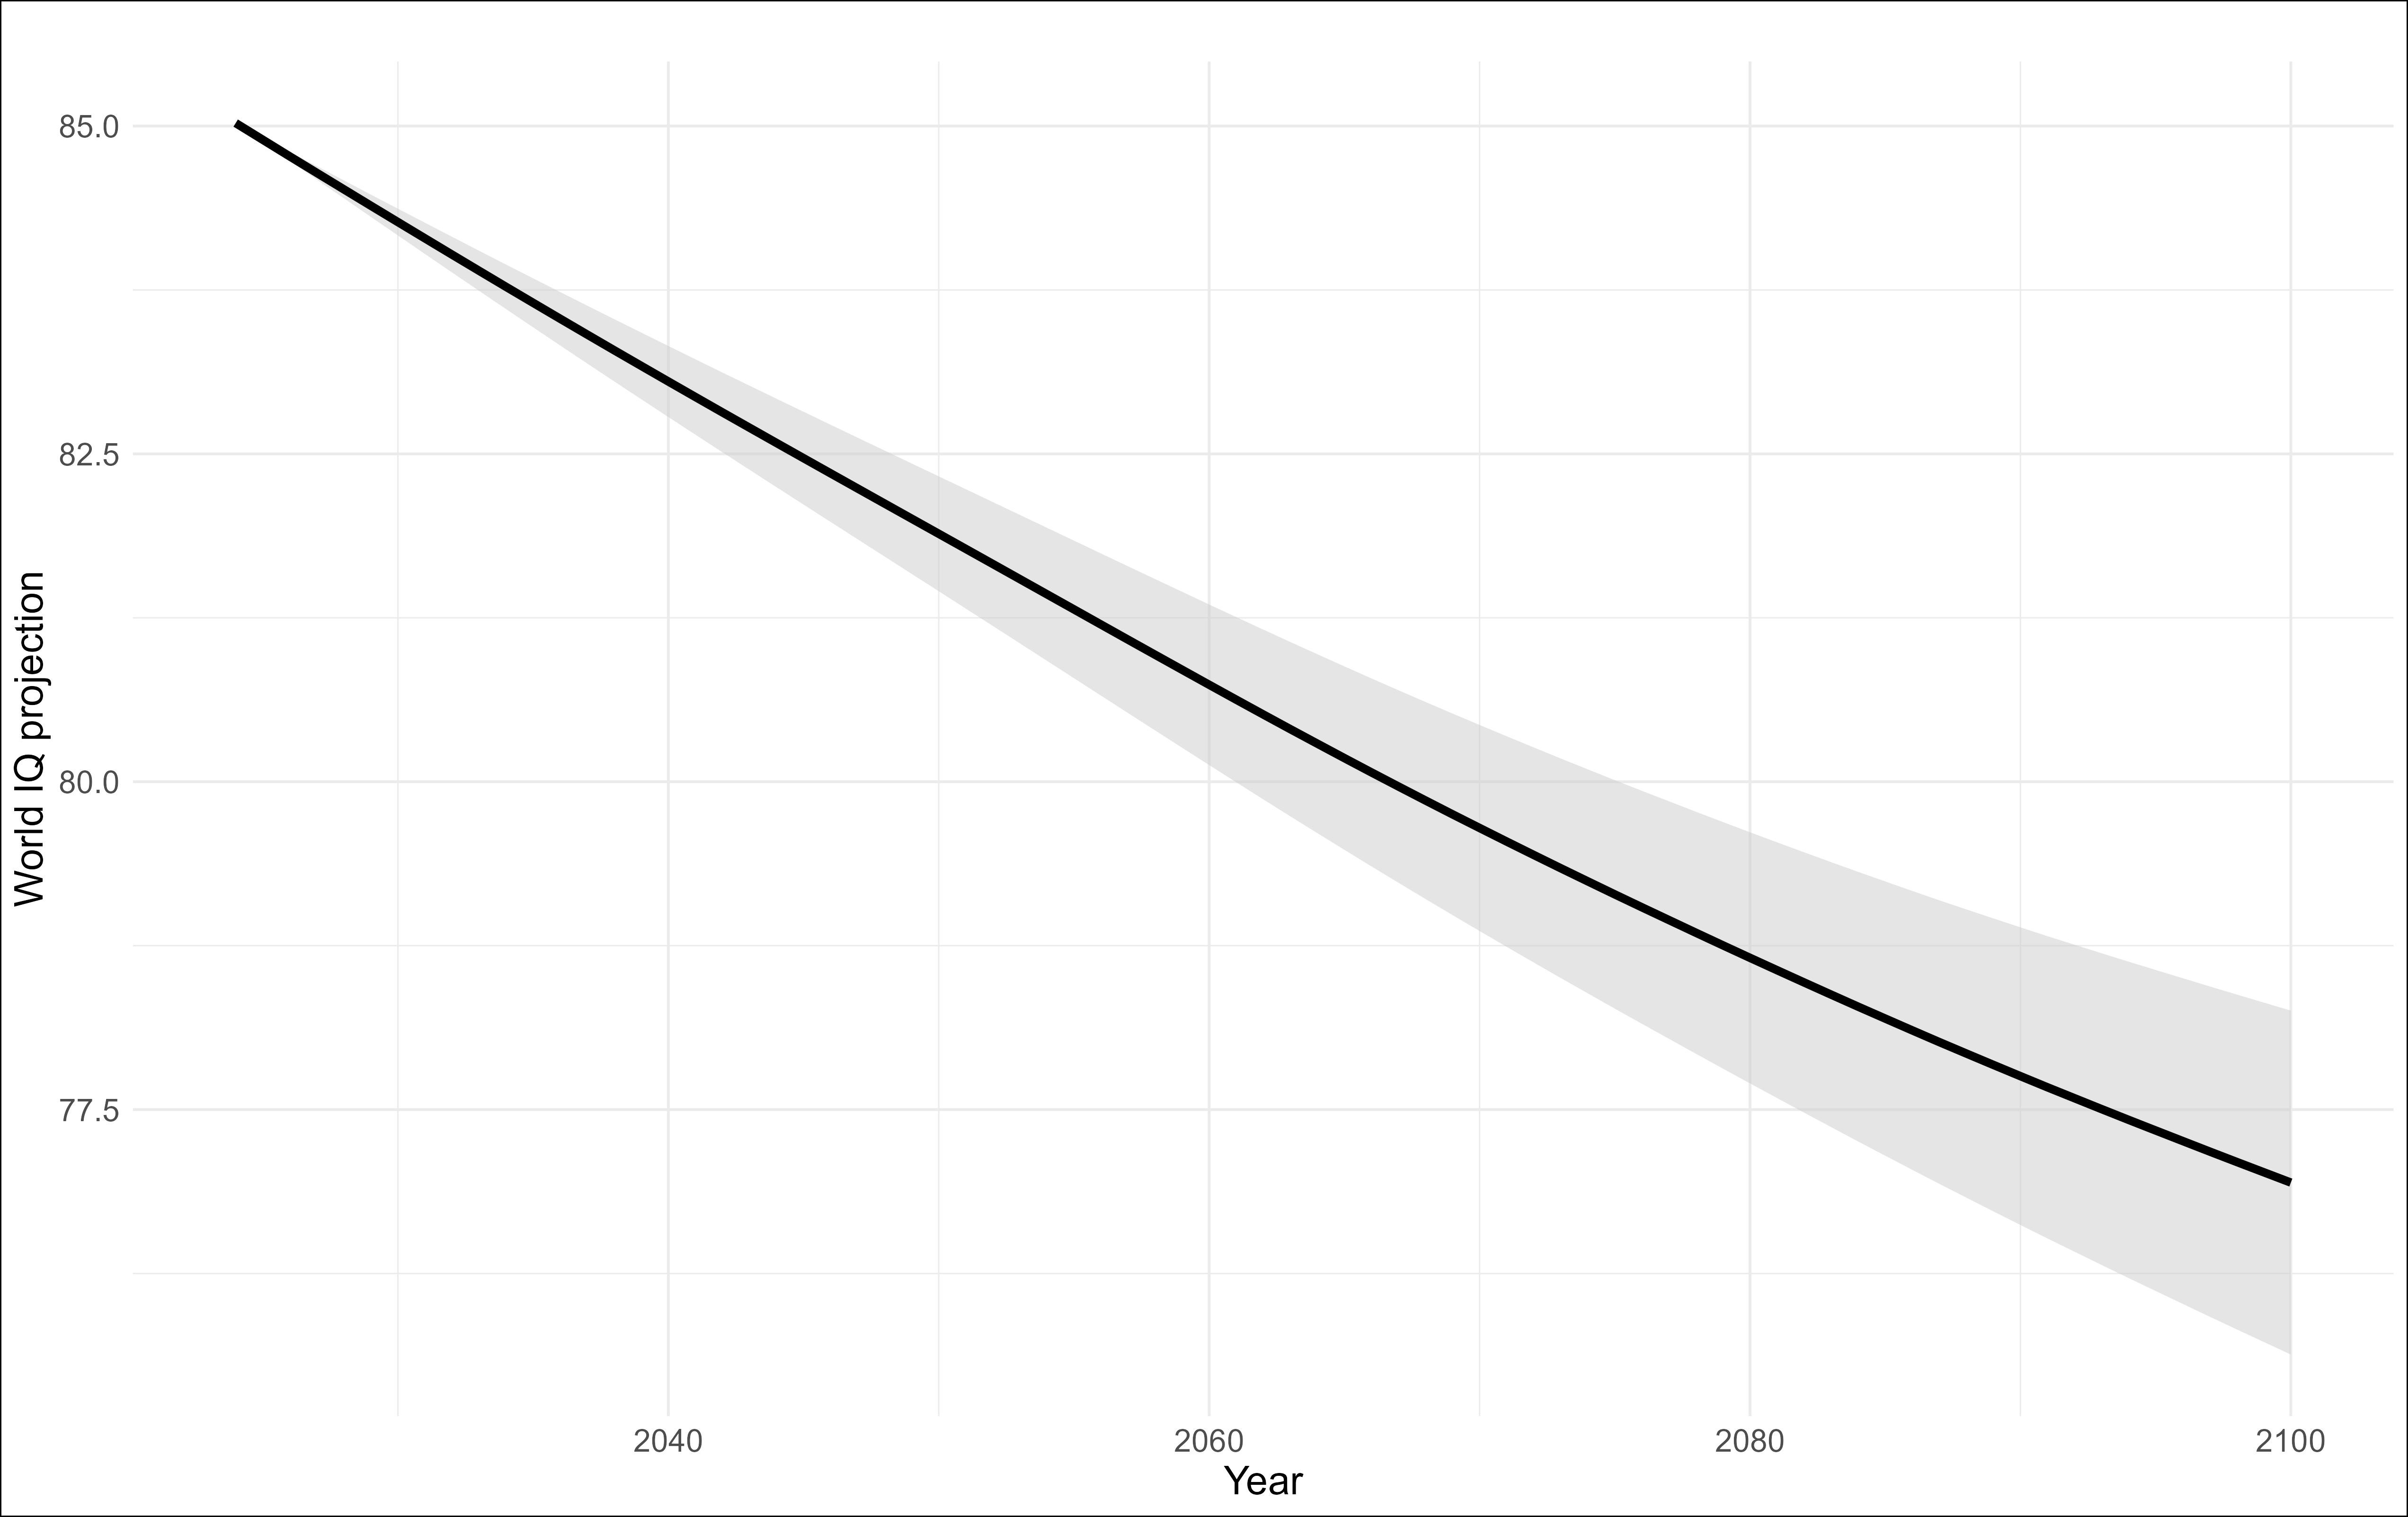
Everybody who looks at this chart has more or less the same reaction: it’s over.
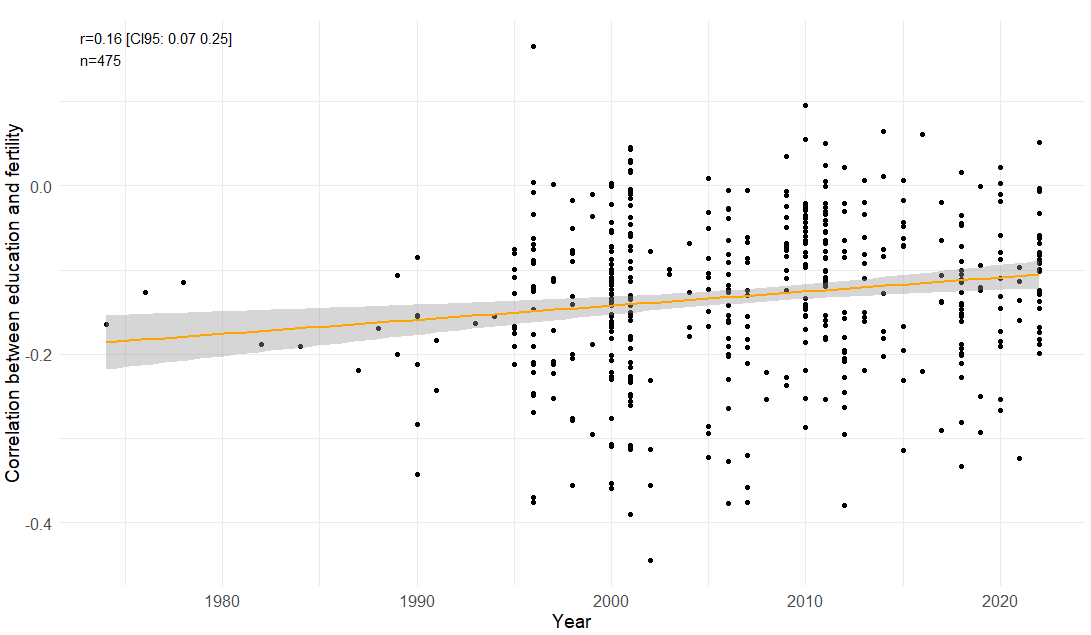
…Not exactly. I think this chart overestimates the decline due to changes in fertility within countries — the correlation between education and fertility has decreased in magnitude over the last 50 years5, according to my own data. Income and fertility are also now weakly positively correlated in most European countries.
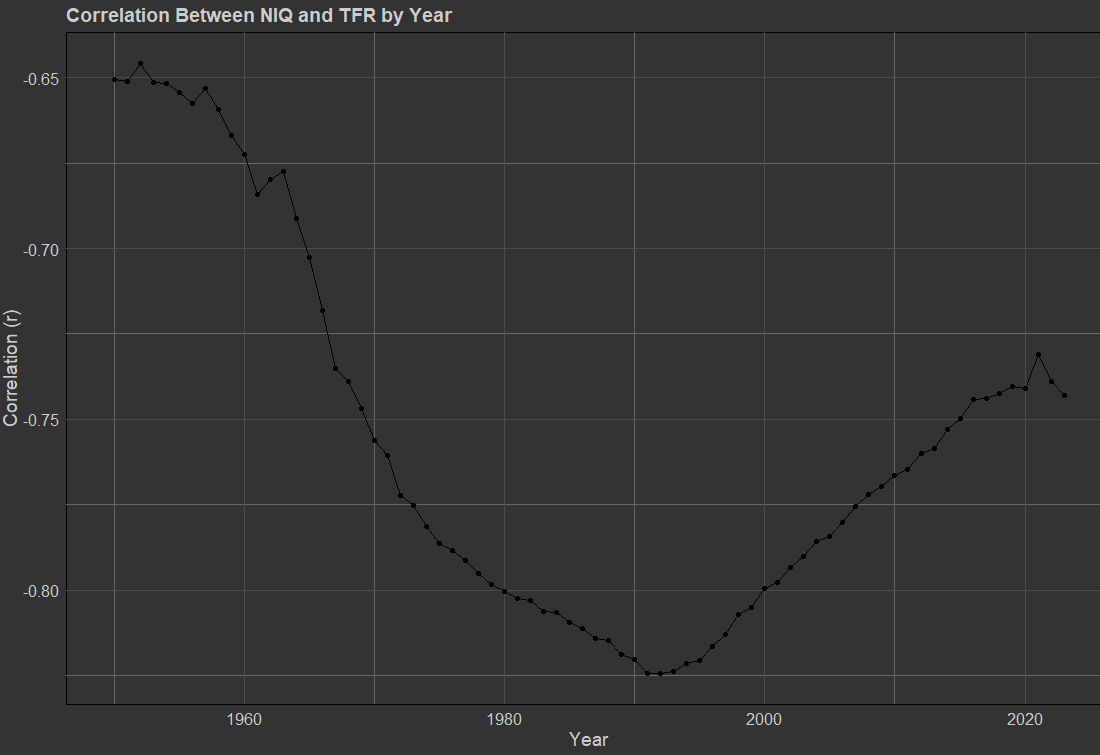
This is also true for the correlation between national IQs and TFR between countries, as middle and low income countries have started to experience declines in fertility:
I still expect the forecast to be roughly true, just an exaggeration of the magnitude of the effect by about 20%, so the world IQ by the end of the century should be somewhere between 78 and 80. Even if the situation ends up being as bad as my models predict, there is still a possibility that economic growth ends up winning because of how strong compounding is.
Training/testing phase
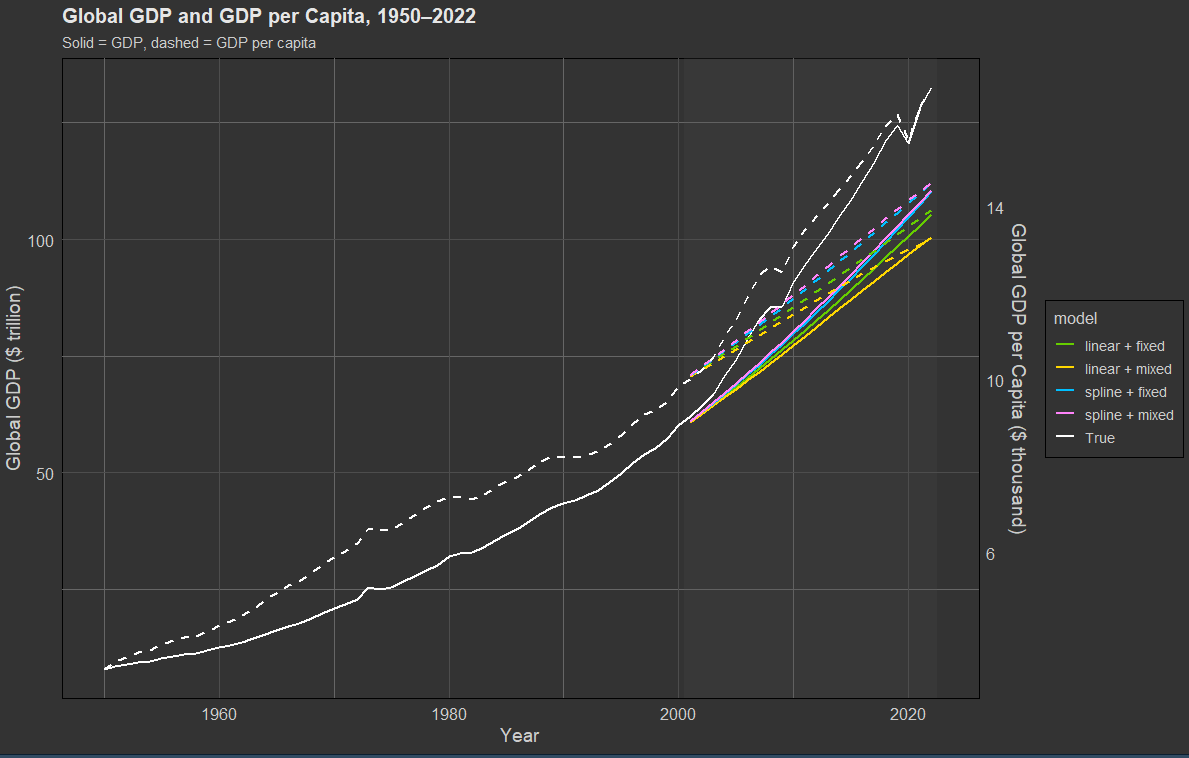
First, I tested my methodology on an old version of the United Nation’s population projections from 20006 that projected all the way to 2050. I also used the NIQ data and the Maddison GDP per capita dataset to model economic growth. For the sake of simplicity, I stuck with the medium population projection and did not integrate variation in IQ estimates over time into the model.
The method I use to forecast economic growth is fairly standard: autoregression, which involves predicting an outcome from a future year based on a past year, and then doing it over and over again. This method can also integrate covariates — the ones I use are age demographics and national IQ. I used 4 different autoregression methods depending on whether they used fixed or mixed effects7, and whether they used a restricted cubic spline (nonlinear effect) to estimate the effect of past GDP per capita8.
The results were not encouraging. On average, all of the models underpredicted GDP per capita by roughly 10% over the course of the 20 years.
Embarrassingly enough, if you take the observed average global GDP per capita growth from 1950 to 2000 (2.2%), and assume the same amount of growth continues into the future, you would predict the global GDP per capita in 2022 to be 15935, just below the observed value of 16744.
The population projections the UN made in 2000 were reasonably accurate — they predicted there to be 7.6 billion people alive in 2022 in contrast to the observed 8 billion on the planet at that time, so I don’t think they are at fault. All of the models gave roughly the same results, so I don’t think the modelling strategy is at fault either.
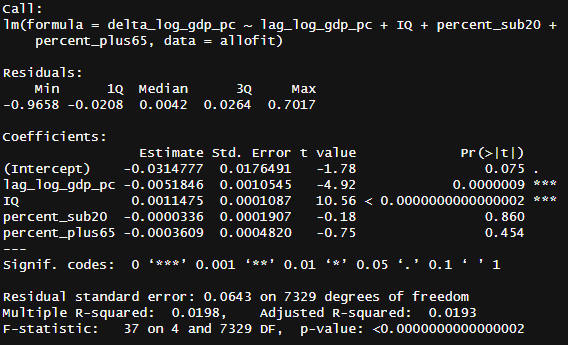
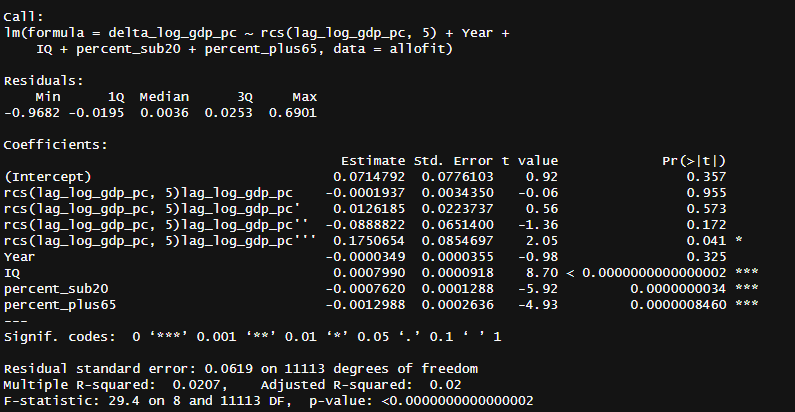
The dataset I used to train the model on had only 7334 rows of complete data, which might sound like a lot, but it’s not enough to generate predictions at this granularity. The coefficients for the effects of population ageing aren’t even statistically significant in the fixed-effects models:
To prove this, I used cluster bootstrapping to measure how much error in the model’s parameters contribute to error in predictions (the bootstrap only accounted for the error in the mode, not anything else). Unfortunately, the mixed-effect models could not be bootstrapped because they used country-based effects, so only the normal fixed-effect models were used.
Some of the variance could be attributed to sampling error, but there’s still a residual upwards trend that cannot be accounted by it. The 2000s in particular were a strong decade for growth internationally as China and the Soviet bloc countries were starting to reap the rewards of their market reforms, so it’s not too surprising that the model failed for this particular time period.
Prediction phase
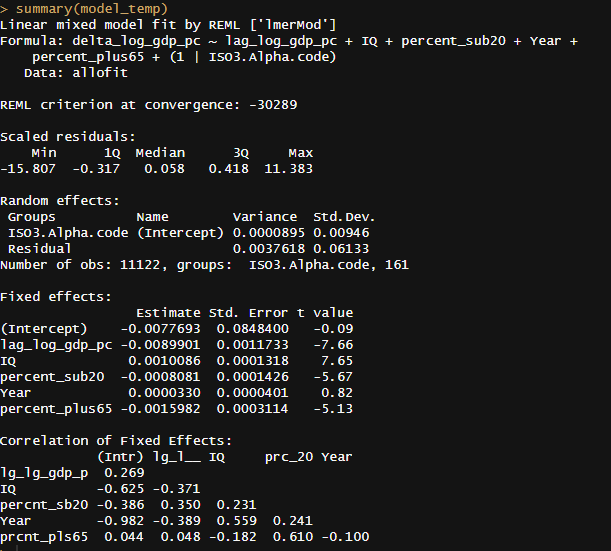
Here I use the same data I used in the prior post, but with the UN’s 2024 population projections instead, so the training dataset has 11,000 rows of information on demographics, IQ, and GDP per capita. The first thing I tested was whether there was a year trend, and there was — growth has been slowing down over time.
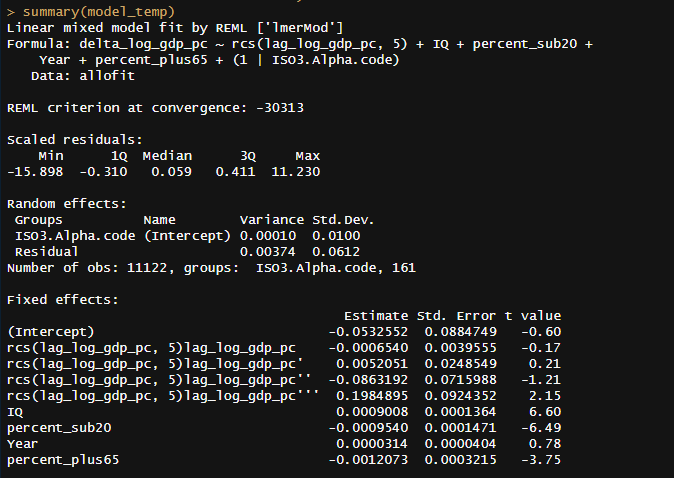
However, when one controls for (projected backwards, not measured) declines in IQ and demographic shifts, the year trend is no longer statistically significant and is 77% smaller. This was also true even when I fiddled with the models and introduced splines or different types of effects9.
People have observed this slowdown effect before and have their own theories about it, but I think this one is a good statistical fit. The channels by which this growth slowdown effect operate might not be intuitive, e.g. wealthier economies might increase their regulations and discourage entrepreneurship, but this does mean that any theory of declining economic growth will have to account for demographic changes.
As I did in the previous example, I will be attempting to forecast GDP per capita with four different models based on whether they have fixed/mixed effects and model the effect of prior GDP per capita on current GDP per capita. I will be using three different population forecasts: the low variant, the medium variant, and the essentialist variant. I also model uncertainty in IQ trajectory by forecasting with each individual set of IQ projections that I previously created.
The results suggested that differences in modelling and population scenario had far more bearing than variation in national IQ (which is represented by the width of the individual bars):
As in the previous example, I will use bootstrapping10 to generate CI intervals for the fixed-effect models.
This is the projection for GDP per capita:
This is the forecast for GDP:
Estimating retirement burden
So, the idea is basically that working-age adults have their incomes collected by the government and said resources are then redistributed to retirees. X% is the missing variable which acts as a measurement of retirement burden. Internationally, pensioners recieve about 61% of their income when they retire in OECD countries, though the figure is typically lower in poorer economies, so I will assign a blanket estimate of 50%.
There is no pretense here that it is possible to forecast whether a given country will become fiscally insolvent due to aging populations and lowering GDP per capita. I don’t think that would even be possible with better methods and more data, the issue is that it’s not possible to know what decisions policymakers will make in response to crisis. Some countries like Singapore have private pension systems so they are more robust to the effects of evolving demographics, but that’s besides the point — public systems are the standard and I am not focusing on the fate of individual countries.
Instead, what I intend to do is to estimate the % of countries that will be under stress due to the effects of demographic decline. From what I gather online, spending over 15-20% of GDP on pensions seems to be the figure that most economists and policy-makers cite as unstable; I didn’t look too much into it but it sounds reasonable to me — I’ll stick with 20% for now. For context, the nations that spend the most in the world on their pensions are Italy and Greece, at 18%. These are the percentages by population projection type:

Here estimates vary significantly by population projection: the low fertility variant forecasts that 40% of nations will be fiscally insolvent by 2100 due to pensions, while the medium variant forecasts that only 10% will. The essentialist variant is somewhere in between. Given the conservative bound I used for what constitutes a crisis (20%) and that nations vary greatly in their spending and policies, I think it’s inevitable that several developed countries will face a pension crisis this century.
On a national scale, the countries most likely to face major issues with pensions are South Korea, Chile, Taiwan, Japan, and most of Southern Europe.
I think that fiscal crises will start popping off earlier than 2050 because the modelling strategy — blanket estimates for pension size and no hedonic treadmill — cause the variance in insolvency risk to be vastly underestimated.
What will actually happen
The main reason why aging populations have such a negative impact on GDP per capita is that most people tend to retire when they come of age. The other reason is that most innovation and new technology, which drives long term economic growth, tends to come from people between their 20s and 40s. Aging populations will not forget the old technologies, but they will struggle to create new ones, leading to lower levels of long term growth.
Besides these two effects, I don’t think that aging populations are much of an issue, and that it’s unlikely that we will see the global economy tank. Given that the previous modelling attempt underpredicted growth, and that I predict many elderly people are going to remain working against their wishes, this is my relatively positive prediction:

Regarding fertility, I don’t think the declines are a mystery. Fertility is falling in ~90% of countries at the same time, which is suggestive of a cultural or technological cause rather than an economic one. As such, I think it’s unlikely that policy interventions will be able to control population figures.
Most people only want 2-3 children, if at all, so fertility preferences in most countries are only just above replacement in most countries; in China they are below. This is fertility in an ideal world: a world where people are dating somebody they are satisfied with and feel materially ready to have children11. Which is well, not happening for most people.
It’s also possible to plot the rate at which fertility changes, and it’s clear that fertility started falling once smartphones and the mass internet started taking off.
If you ignore the first fall that came it looks like the long term trend is that the rate at which fertility is changing is approaching zero. Which means that the change in fertility is going to be closer to the medium variant than the low variant, for better or for worse. For reference, see:
If you take an account of all the biases:
Old people aren’t some magical curse that causes GDP shrink: they slow down economies by retiring and making less new technology. The former will be an issue if it is not correctly addressed politically, and the latter only leads to stagnation.
Global IQ is likely to be higher than predicted.
The likely fertility future is somewhere between the medium and low variant, but closer to the medium variant.
Improvements to life expectancy will continue to see diminishing returns.
Essentialism is true and moving people from country to country leads to no net global economic changes in the short term (and negative ones in the long term).
I think we are going to be fine. Not good, but not collapsing any time soon.
Political implications of this information
Governments facing fiscal troubles have three choices:
Raise taxes.
Cut pensions.
Do nothing and suffer from debt and/or hyperinflation.
3 is obviously the worst outcome here. It would be nice if we still had something like the gold standard, unfortunately economists have brainrot and think that having constant inflation is necessary for growth.
Raising taxes vs cutting pensions involves two tradeoffs: one of them is the tradeoff in labour, where raising taxes results in less time spent working in both the youth and elderly, but cuts economic growth; cutting pensions puts more people in the workforce, but maintains economic growth. The former benefits the old and attracts people with leftist values, while the latter benefits the youth and attracts people with right wing values. I’m not sure who is going to win, I haven’t thought about it too deeply.
Pensions and spending will become the most pressing issue in any country that starts to spend over 20-25% of its GDP on pensions, in some nations like Korea or Spain I predict it to overshadow literally everything else, kind of like how WW2 drowned out every other political concern. Everybody will have a stake in the debate, regardless of their age and income.
Prognosis by nation
Albania looks rough, no matter what happens with demographics.
The United Arab Emirates looks very rough if no labour is imported. All the other oil baron countries look more or less the same.
Argentina could get very bad, depending on how birth rates work out.
Armenia looks iffy.
Australia looks fine.
Austria looks iffy.
Azerbaijan looks OK.
I have no idea what happened with this population projection.
Belgium looks iffy.
Brazil looks iffy.
The essentialist (aka true) projection looks bad for Canada.
Switzerland looks iffy.
Chile is a nightmare.
China looks high variance.
Czechia looks OK.
Germany looks bleak, but passable.
Denmark looks OK.
Spain is toast.
Estonia could get bad.
Finland spends a lot on pensions in the real world, but they presumably could cut back on them.
France is OK.
I’d say Britain would be fine if I wasn’t aware of how awful their politics are.
Greece looks rough.
Croatia could get bad.

Hungary looks OK.
Indonesia is on track to becoming wealthier than Greece.
India looks good relative to where it already is.
Ireland looks OK.
Iran could get really bad.
The model predicts that Iraq will be doing much better at the end of the century. I think this could happen if things improve politically.
Iceland looks iffy.
Israel looks really, really good.
Italy looks awful.
Jamaica could get surprisingly bad.
Japan looks better than I expected.
Kazakhstan looks good.
South Korea looks terrible.
Libya looks good, assuming they fix their political situation.
Lithuania could get bad.
Malta is cooked.
Montenegro could get ugly.
Mongolia looks good.
Malaysia looks good.
Netherlands look OK.
Norway looks iffy.
New Zealand looks OK.

Poland looks bad.
Puerto Rico…
Portugal looks iffy.
Romania looks iffy.
Russia looks far better than I expected.
Singapore looks wild. If I recall correctly, they have a private pension system, which should protect them from a fiscal crisis.
Serbia could get bad.
Sweden looks iffy.
Thailand looks iffy.
Turkmenistan looks good.
Turkey looks iffy.
Taiwan looks bad.
Ukraine, in light of recent events, looks awful.
Uruguay looks bad.
The United States looks decent.
TODO list for V2
Use communist history as a past/future covariate, which could perhaps help with correcting under-prediction during the 2000-2022 period.
Use the 3rd version of the NIQ dataset for the forecasts, which integrates the countries from the previous datasets that got passed over in data collection.
Use ML/DL or other models in addition to standard autoregression to predict fertility and life expectancy, then with those predict population figures, then with said population figures the GDP per capita estimates can be made. I would have to get a better video card first, though. (Currently using RX6600).
Integrate multiple sources of GDP per capita into one dataset. I didn’t want to do this here because it turns out that integrating the various datasets lowered the quality of the models, but with ML/DL the different datasets can be labelled and the models could adjust accordingly. The problem here though is that ML/DL have issues generalising outside of their reference bounds and it will be difficult for them to infer what happens when 50% of people are over 65 when the oldest countries in the training dataset have maybe half of that.
Only use essentialist models.
Use different age categories, I think 0-15, 15-25, 25-50, 50-75, >75 would be best, the categories 15-25 and 50-75 can serve as liminal spaces between dependents and working-age people.

Currently, the training dataset currently includes 11,122 rows and 160 countries; the UN’s population projections contain 235, so the theoretic maximum size of a training dataset that goes from 1950 to 2025 is 17,775. Were this to be combined with superior methodology and communist history, I think the error bars in the projection could be shrunk by 40% or more.

That aside, I do think that resource depletion is concerning, especially since renewable alternatives are either expensive (e.g. solar, wind) or politically unfeasible (nuclear).
The causal effect is probably like 25% lower, I don’t fully buy the causation goes in one direction.
I should note that these projections do not make any assumptions about the genetic or environmental causes of intelligence between individuals and nations — the projection within countries is built on the widely replicated result that parents and children resemble each other in terms of intelligence, and that the national IQ/test score differences between countries tend to be very stable.
True when controlling for source, cohort, and country:
Test-training splitting doesn’t work here because I would be cheating by predicting the future with… The future. I also forgot how I downloaded this data, but I’m pretty sure it was from the UN’s website.
The mixed-effects models also integrated country-specific effects, while the fixed-effect models did not.
The difference between the spline and linear models passes statistical significance in terms of fit by any margin in both the UN2000 and UN2024 datasets, but I’m hesitant to conclude that the statistically significant model is better purely on that basis.
Spline model:
Mixed-effects:
Mixed effects + spline:
100 iterations per national IQ projection, population projection, and model type. Couldn’t do more, even with my threadripper + 128 GB RAM, because of how computationally intensive the process is.
The feeling is important — wealth/income has a marginal effect on fertility based on randomisation studies.
Super interesting!
I would be curious as to whether the graphs would look dramatically different if, instead of taking the UN population projections which assume mean-reversion (very unclear if / how soon that'll happen) it instead assumes that the birth rates stay at their current levels in each country.
Pension argument is not sound. Some places like Chile have partially or fully transitioned away from PAYGO system. They have individual, private accounts for retirements. Another example is Mexico, which transition in 1997 with those born 1980-present (and 2007 for federal employees) to the AFORES system . Countries like Mexico/Chile better ground than Argentina/Brazil/Spain, which are countries that never transitioned out of PAYGO system