

Most of the negative health effects of smoking do not come from nicotine itself. Very few people get addicted to nicotine in the form of gum. As such, nicotine could potentially be used as a stimulant or nootropic, the same way people use caffeine or amphetamines.
In the scientific literature, what caught my attention was a large meta-analysis on the effect of nicotine on cognitive performance. It was incorrectly executed, so I decided to run on my own. Several of the studies reported multiple effect sizes from multiple groups, so I tracked them. I divided the sample sizes by the number of effect sizes that were reported for each individual group, to get an estimate of the effective sample size of each study.
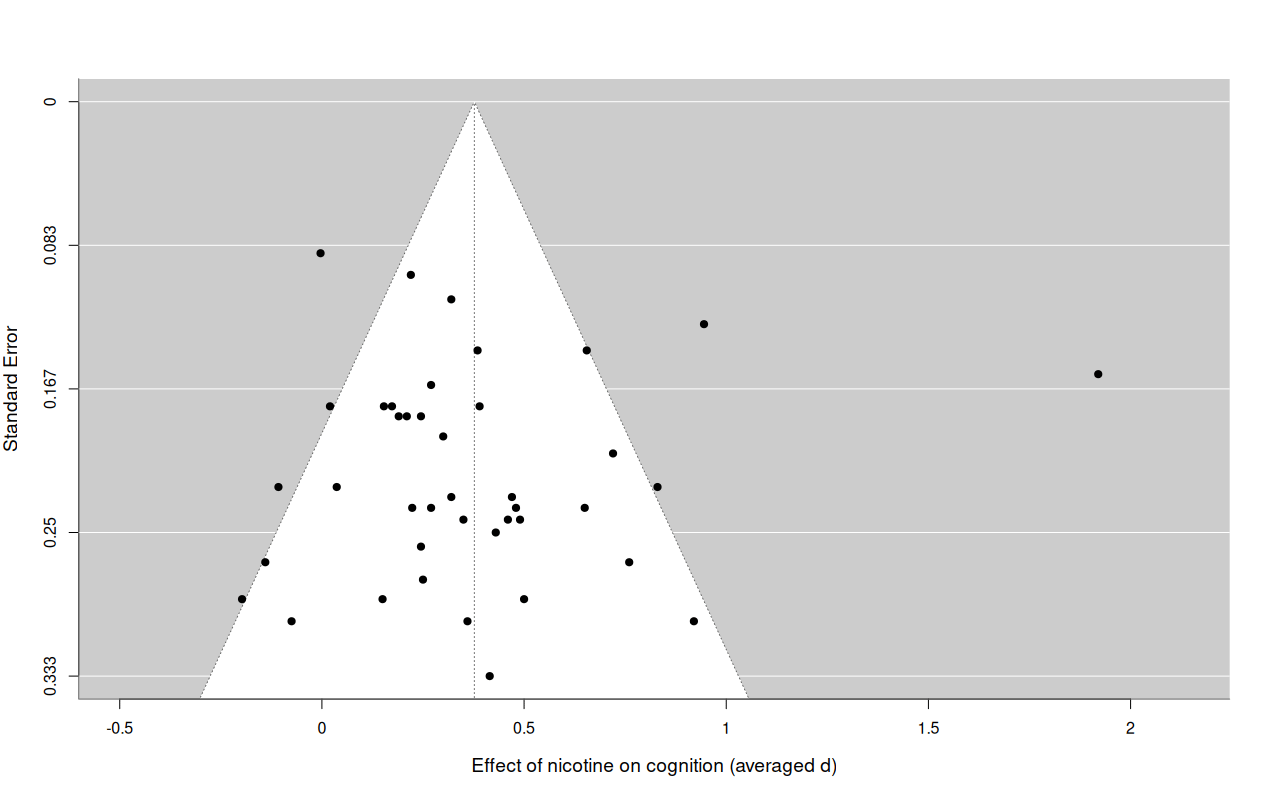
The aggregate effect size is about 0.38 SD, translating to 6 IQ points.
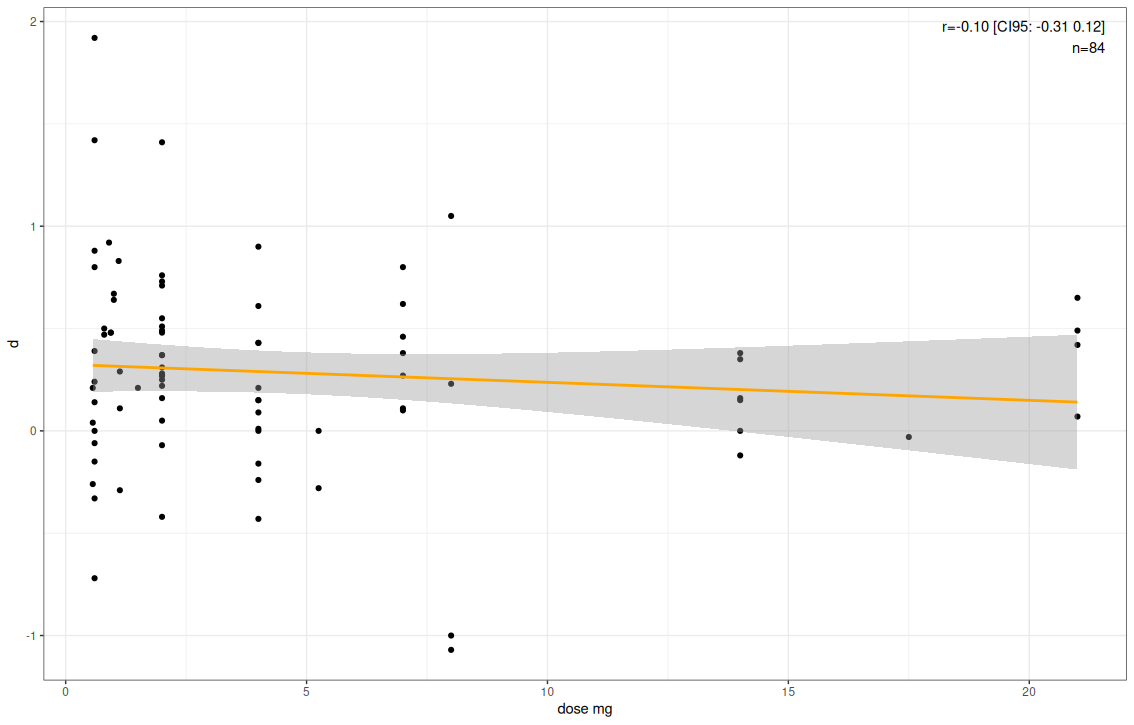
There is no dose-response relationship.
The quick-and-dirty meta-analytic effect is 0.33. The existence of it was extremely unambiguous (p < .0001).
Random-Effects Model (k = 84; tau^2 estimator: REML)

  logLik  deviance       AIC       BIC      AICc
-53.6688  107.3375  111.3375  116.1752  111.4875

tau^2 (estimated amount of total heterogeneity): 0.1178 (SE = 0.0320)
tau (square root of estimated tau^2 value):      0.3432
I^2 (total heterogeneity / total variability):   62.10%
H^2 (total variability / sampling variability):  2.64

Test for Heterogeneity:
Q(df = 83) = 255.1649, p-val < .0001

Model Results:

estimate      se    zval    pval   ci.lb   ci.ub
  0.3250  0.0508  6.3939  <.0001  0.2254  0.4246  ***

---
Signif. codes:  0 ‘***’ 0.001 ‘**’ 0.01 ‘*’ 0.05 ‘.’ 0.1 ‘ ’ 1
I tested for moderators; none of them were significant in the aggregate: dose, smoking status, or domain of cognition.
Mixed-Effects Model (k = 84; tau^2 estimator: REML)

  logLik  deviance       AIC       BIC      AICc
-46.0473   92.0946  116.0946  143.5801  121.2946

tau^2 (estimated amount of residual heterogeneity):     0.1155 (SE = 0.0342)
tau (square root of estimated tau^2 value):             0.3399
I^2 (residual heterogeneity / unaccounted variability): 60.32%
H^2 (unaccounted variability / sampling variability):   2.52
R^2 (amount of heterogeneity accounted for):            1.91%

Test for Residual Heterogeneity:
QE(df = 73) = 216.0037, p-val < .0001

Test of Moderators (coefficients 2:11):
QM(df = 10) = 12.2553, p-val = 0.2683

Model Results:

                                           estimate      se     zval    pval    ci.lb   ci.ub
intrcpt                                      0.3758  0.1788   2.1018  0.0356   0.0254  0.7262  *
smoking_statusSmoker                         0.2308  0.1140   2.0247  0.0429   0.0074  0.4542  *
dose_mg                                     -0.0150  0.0099  -1.5103  0.1310  -0.0344  0.0045
domainAlerting attention-RT                  0.0017  0.2076   0.0082  0.9935  -0.4052  0.4085
domainFine motor                            -0.1482  0.2320  -0.6390  0.5228  -0.6029  0.3065
domainLong-term episodic memory-accuracy    -0.1982  0.2106  -0.9411  0.3467  -0.6109  0.2146
domainOrienting attention-accuracy          -0.0517  0.2740  -0.1887  0.8503  -0.5888  0.4854
domainOrienting attention-RT                 0.0655  0.2159   0.3034  0.7616  -0.3576  0.4887
domainShort-term episodic memory-accuracy    0.0902  0.2133   0.4231  0.6722  -0.3278  0.5083
domainWorking memory-accuracy               -0.3580  0.2436  -1.4694  0.1417  -0.8355  0.1195
domainWorking memory-RT                     -0.0367  0.2328  -0.1577  0.8747  -0.4930  0.4196

---
Signif. codes:  0 ‘***’ 0.001 ‘**’ 0.01 ‘*’ 0.05 ‘.’ 0.1 ‘ ’ 1
I averaged all of the effect sizes of the individual publications to estimate publication bias. The regression test suggested that if there was any publication bias, it was likely negative — people wanted to report nulls more than positive effects.
#Meta-analysis with aggregated effect sizes
Random-Effects Model (k = 41; tau^2 estimator: REML)

  logLik  deviance       AIC       BIC      AICc
-18.3017   36.6034   40.6034   43.9812   40.9278

tau^2 (estimated amount of total heterogeneity): 0.1088 (SE = 0.0344)
tau (square root of estimated tau^2 value):      0.3299
I^2 (total heterogeneity / total variability):   75.42%
H^2 (total variability / sampling variability):  4.07

Test for Heterogeneity:
Q(df = 40) = 182.8701, p-val < .0001

Model Results:

estimate      se    zval    pval   ci.lb   ci.ub
  0.3769  0.0616  6.1155  <.0001  0.2561  0.4978  ***

##### Regression test for publication bias

Regression Test for Funnel Plot Asymmetry

Model:     mixed-effects meta-regression model
Predictor: standard error

Test for Funnel Plot Asymmetry: z = -0.5439, p = 0.5865
Limit Estimate (as sei -> 0):   b =  0.4960 (CI: 0.0497, 0.9422
So, it does seem that the effect of nicotine on intelligence is real, just not exciting — maybe an increase of 3-8 IQ points. I should note that, if the effect is indeed generalised. The effects of it on real world outcomes and broader cognitive function haven’t been studied very well, so it’s difficult to tell how much the cognitive enhancement generalises.
Other notes
Nicotine, through smoking, increased performance on the Raven’s test by 6 IQ points, but the effect barely passed significance testing.
Nicotine reduces insepction time by about 0.5 SD (good), and the study had low p-values in the 0.001-0.01 range. Seems legit.
One study claims nicotine increases mental speed, but not performance on intelligence tests. I’m not inclined to put much weight into this finnding, as they had just 55 subjects. The effects of amphetamines on IQ/SAT type tests, for example, are very small (d = 0.05-0.15), but probably real.
So basically, a single miligram of it? I am skeptical but also hopeful here. It might be good, taken rarely (once or twice a month maximally, avoiding tolerance development) for either 1) initiating the study or practice of something unfamiliar or 2) having to combine multiple methods to set up an environment/ecosystem that makes things possible 3)pushing through something especially difficult individually or 4)bundling cognitive tasks together
I'm not understanding the conclusion that few people get addicted from the gum itself. from the conclusion it seems like 2/5 very much DID get addicted from the gum itself?
https://pmc.ncbi.nlm.nih.gov/articles/PMC1939993/
Five never smokers used the nicotine gum daily. They had been using the nicotine gum for longer than the 429 ever smokers (median = 6 years vs 0.8 years, p = 0.004), and they had higher NDSS-gum Tolerance scores (median = 0.73 vs = -1.0, p = 0.03), a difference of 1.5 standard deviation units. Two never smokers had never used smokeless tobacco, both answered "extremely true" to: "I use nicotine gums because I am addicted to them", both "fully agreed" with: "after a few hours without chewing a nicotine gum, I feel an irresistible urge to chew one" and: "I am a prisoner of nicotine gum".
2/5 seems pretty high, a 40% addiction rate here.
Hopeful we get more studies on this. Any dosage of anything to literally improve IQ is an insanely outsized benefit. It warrants investigation then standardization. I won't be surprised if we figure something out in the future that's like ozempic and a strong-enough boost in cognition, on wider scales.
Isn’t no dose response a huge red flag?